 Legend
99 posts
Legend
99 posts
PowerPoint sometimes gets a bad rap but I truly believe in the ‘power’ that PowerPoint has available.
In this post, I wanted to share with you one of the ways I use PowerPoint to supplement what I want to accomplish in Adobe Captivate.
Meters
I love using meters in my activities. Whether that is a progress meter or some sort of indication of success, meters can be a great way to inform the learner of how they are doing. There are tons of possibilities with your creative touch – nothing is off the table at this point.
I use PowerPoint regularly as my graphics editor and making meters is a task I do often. I find it to be very simple to create and manipulate the shapes to get the outcome I need. In this example, I will make a simple meter that tracks time in 5 minute increments. These increment images become image states in Captivate which display based on your variable values and logic. This post will address the methodology of creating the images rather than working out the logic.
**Please note that this is not a live timer but a meter that will change based on variables that you assign and are updated as a learner makes choices.
**Also note that I duplicate slides at each step. This helps the creation but also helps when mistakes are made – less things to fix.
Creating the Images (Clock Style)
Step 1 – Make a circle shape. You can ensure the circle is round rather than oval by holding the shift key while you drag it out. Color the circle to your design. In this example I will use a light red color. This is the color that will reveal as “time passes”.

Step 2 – Make a very thin rectangle shape and center it on the circle. I use a good contrasting color so it is easy to find.
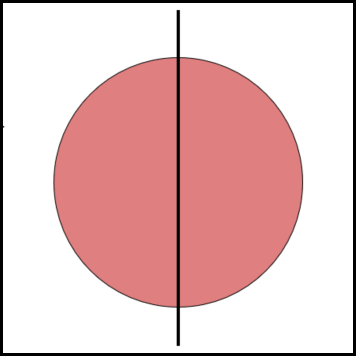
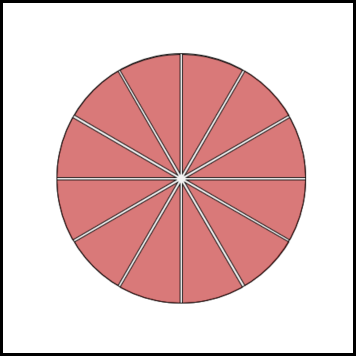
Step 3 – Make as many copies of the thin rectangle as you need to segment the meter into the number of divisions you desire. Make sure they are all centered. Then rotate all of the rectangles based on the number segments so they are all equal. In this example, I created a total of six rectangles so I could have 12 equal segments representing 5 minutes each. (360 degrees / 12 = 30 degrees) I rotated the remaining 5 rectangles by an increasing 30 degrees for each one.
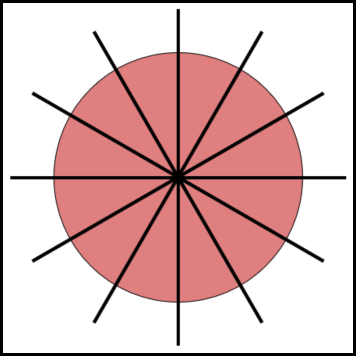
Step 4 – Select all of the objects making sure that you select your circle first so that your formatting remains. Then fragment them. You should notice a change to the rectangles based on the formatting of the circle.
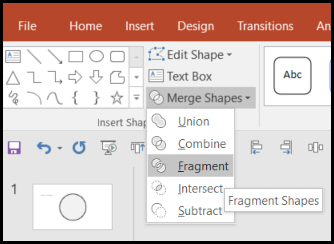

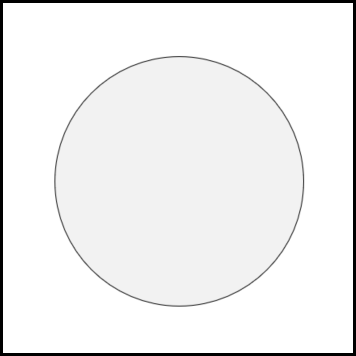
Step 5 – Make a copy of the first circle and reformat it to the color of the timer. In this example, I am going with a greyish-white. It is important to remind you that I have been duplicating slides at each step. This helps ensure that all my objects stay in the exact same position. This is critical for the next phase of this setup as we will be copying and pasting from one slide to another and that keeps them properly placed.
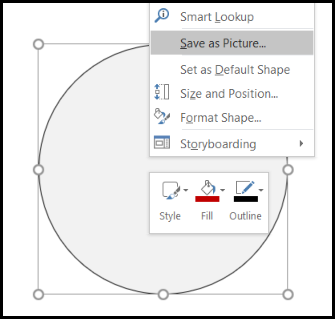
At this stage you can perform a right-click and ‘Save as Picture’. This will be the starting of your image states in Captivate.
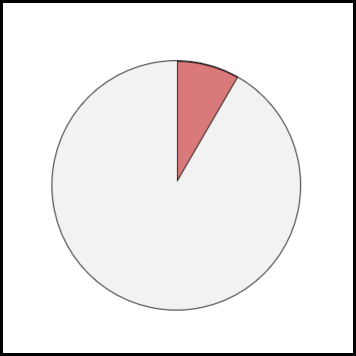
Step 6 – Go back to your fragmented slide. Select the first segment and copy it (CTRL-C). Go to the slide with the circle you just made and re-colored. Paste the segment (CTRL-V). It should appear in the same spot. Group them by selecting everything and (CTRL-G) then save as picture again. This will be your next state.
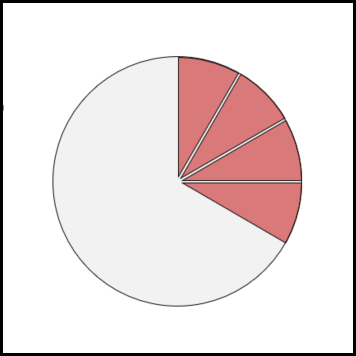
Now ungroup them (CTRL + SHIFT + G) and go back to the fragment slide to grab the next piece. Paste the next one in place, group, and save as picture.
Repeat the procedure until you have created images of each step of the meter.
Step 7 – Now you can import each of the images to Captivate and you could use either the blank circle as a start point or the full circle where segments disappear. Each image is a state that you can utilize the ChangeState function of Captivate to display them based on parameters that you choose.
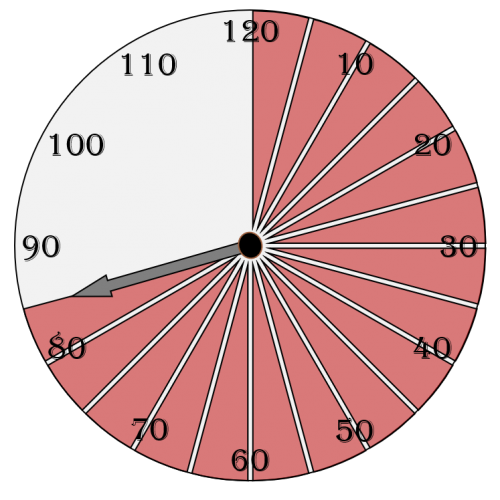
Here is a pic of my version of this in one of my applications. In the scenario where this is used, I give the learner “two hours” to perform the task. Each decision they make along the way costs them “time”. The meter fills up to show how much “time” has been spent on the task. As you can see, I added a few additional elements to this one such as the little hand that follows along like a clock and the numbers as well to help read the time.
PowerPoint is a really useful tool that makes creating these sorts of things very easy and is an amazing supplement to Captivate.
Hopefully this was helpful for someone. Feel free to ask questions about this.
PowerPoint sometimes gets a bad rap but I truly believe in the ‘power’ that PowerPoint has available.
In this post, I wanted to share with you one of the ways I use PowerPoint to supplement what I want to accomplish in Adobe Captivate.
Meters
I love using meters in my activities. Whether that is a progress meter or some sort of indication of success, meters can be a great way to inform the learner of how they are doing. There are tons of possibilities with your creative touch – nothing is off the table at this point.
I use PowerPoint regularly as my graphics editor and making meters is a task I do often. I find it to be very simple to create and manipulate the shapes to get the outcome I need. In this example, I will make a simple meter that tracks time in 5 minute increments. These increment images become image states in Captivate which display based on your variable values and logic. This post will address the methodology of creating the images rather than working out the logic.
**Please note that this is not a live timer but a meter that will change based on variables that you assign and are updated as a learner makes choices.
**Also note that I duplicate slides at each step. This helps the creation but also helps when mistakes are made – less things to fix.
Creating the Images (Clock Style)
Step 1 – Make a circle shape. You can ensure the circle is round rather than oval by holding the shift key while you drag it out. Color the circle to your design. In this example I will use a light red color. This is the color that will reveal as “time passes”.
Step 2 – Make a very thin rectangle shape and center it on the circle. I use a good contrasting color so it is easy to find.
Step 3 – Make as many copies of the thin rectangle as you need to segment the meter into the number of divisions you desire. Make sure they are all centered. Then rotate all of the rectangles based on the number segments so they are all equal. In this example, I created a total of six rectangles so I could have 12 equal segments representing 5 minutes each. (360 degrees / 12 = 30 degrees) I rotated the remaining 5 rectangles by an increasing 30 degrees for each one.
Step 4 – Select all of the objects making sure that you select your circle first so that your formatting remains. Then fragment them. You should notice a change to the rectangles based on the formatting of the circle.
Step 5 – Make a copy of the first circle and reformat it to the color of the timer. In this example, I am going with a greyish-white. It is important to remind you that I have been duplicating slides at each step. This helps ensure that all my objects stay in the exact same position. This is critical for the next phase of this setup as we will be copying and pasting from one slide to another and that keeps them properly placed.
At this stage you can perform a right-click and ‘Save as Picture’. This will be the starting of your image states in Captivate.
Step 6 – Go back to your fragmented slide. Select the first segment and copy it (CTRL-C). Go to the slide with the circle you just made and re-colored. Paste the segment (CTRL-V). It should appear in the same spot. Group them by selecting everything and (CTRL-G) then save as picture again. This will be your next state.
Now ungroup them (CTRL + SHIFT + G) and go back to the fragment slide to grab the next piece. Paste the next one in place, group, and save as picture.
Repeat the procedure until you have created images of each step of the meter.
Step 7 – Now you can import each of the images to Captivate and you could use either the blank circle as a start point or the full circle where segments disappear. Each image is a state that you can utilize the ChangeState function of Captivate to display them based on parameters that you choose.
Here is a pic of my version of this in one of my applications. In the scenario where this is used, I give the learner “two hours” to perform the task. Each decision they make along the way costs them “time”. The meter fills up to show how much “time” has been spent on the task. As you can see, I added a few additional elements to this one such as the little hand that follows along like a clock and the numbers as well to help read the time.
PowerPoint is a really useful tool that makes creating these sorts of things very easy and is an amazing supplement to Captivate.
Hopefully this was helpful for someone. Feel free to ask questions about this.


You must be logged in to post a comment.
- Most Recent
- Most Relevant
Thanks for sharing this idea. Learner metrics based on variables is a great interaction.
