 Newbie
25 posts
Newbie
25 posts
When showing learning results make sure the charts are readable.
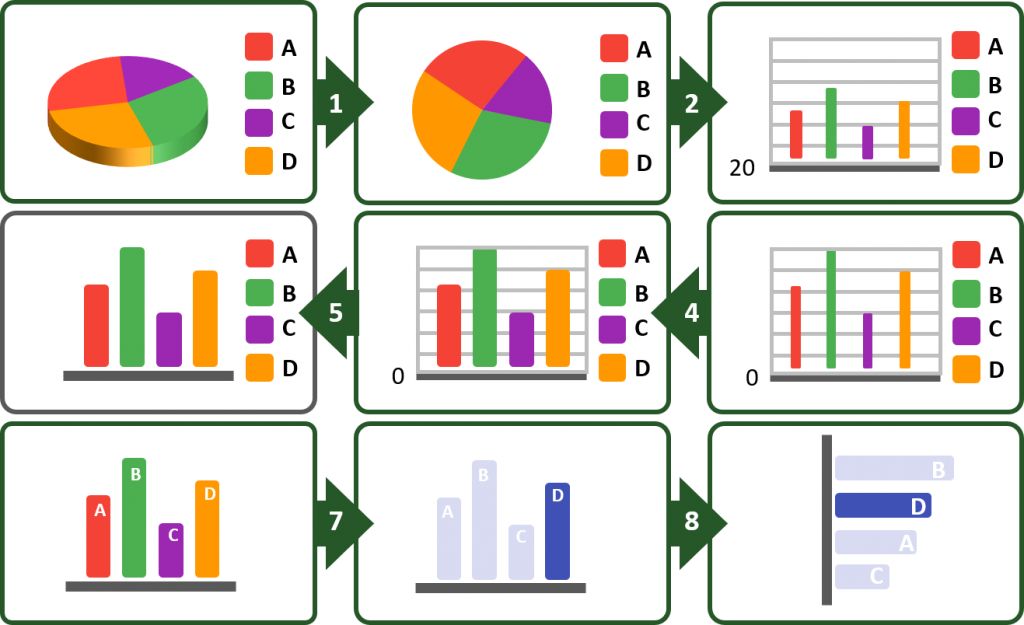
1. Remove 3d from charts, 3D the distorts the data
2. Pie charts are harder to interpret when comparing data
3. Do not manipulate the axis by starting on a non 0 scale
4. Make the bars thick
5. Remove the gridlines
6. Place the legend on the bars
7. Use a monochromatic color scheme with one outstanding color
8. Rotate the chart and sort in size
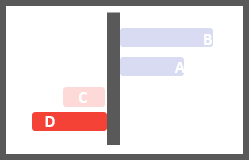
9. When having positive and negative values consider color and axis
A. When using iconography do not use half icons
B. When using iconography do not use scaled icons

This will make your charts glanceable in an eLearning, instead of referenceable
1. Remove 3d from charts, 3D the distorts the data
2. Pie charts are harder to interpret when comparing data
3. Do not manipulate the axis by starting on a non 0 scale
4. Make the bars thick
5. Remove the gridlines
6. Place the legend on the bars
7. Use a monochromatic color scheme with one outstanding color
8. Rotate the chart and sort in size
9. When having positive and negative values consider color and axis
A. When using iconography do not use half icons
B. When using iconography do not use scaled icons
This will make your charts glanceable in an eLearning, instead of referenceable


You must be logged in to post a comment.
- Most Recent
- Most Relevant
the visual display of quantative information – tufte – 0961392142 |
visual explanations – tufte – 0961392126 |
Envision Information – tufte – 0961392118 |
show me the numbers – stephen few – 9780970601971 |
Infographics: The Power of Visual Storytelling – Jason Lankow; Josh Ritchie; Ross Crooks – 978-1-118-31404-3 |
The Functional Art: An introduction to information graphics and visualization – Alberto Cairo – 0321834739 |
Designing Pictorial Symbols – Nigel Holmes – 0823013308 |
Designer’s Guide to Creating Charts and Diagrams – Nigel Holmes – 0823013154 |
The Wall Street Journal Guide to Information Graphics: The Dos and Don’ts of Presenting Data, Facts, and Figures – Wong, Dona M – 0393347281
White Space is Not Your Enemy, 2nd Edition – Kim Golombisky; Rebecca Hagen – 978-0-240-82414-7
Information Visualization: Perception for design – Colin Ware – 978-0-12-381464-7
Thanks for this feedback! It makes the blog much more interesting to see the origins of ideas…
Can you please mention the resources used?
