 Newbie
8 posts
Newbie
8 posts
When speaking with other Captivate authors who publish their files in Cornerstone OnDemand (CSOD), the most frequent complaint regarding CSOD is the lack of quality, usable reporting of SCORM 2004 data. CSOD has a total of three SCORM 2004 reports and only one of these reports, the ‘Course Assessment Question Item Analysis’ (CAQIA), gives you data showing what users have selected or entered for graded SCORM objects. Unfortunately, all of the data you get is aggregated together so you can’t see how individual users did on specific questions. The structure of the Excel file you get is also poorly constructed as it appears that it’s intended to be printed instead of a dump of the data where you could then filter, sort, and manipulate the information. Fortunately, you can ask CSOD to enable SCORM interaction ID data in custom reports to get per-user data in a typical spreadsheet format.
As I mentioned previously, the CAQIA report does give you some data but the layout of the Excel file is why the report is really bad. The image below shows one of the questions from this type of report. I’ve added the cell borders to help show how the report is structured.
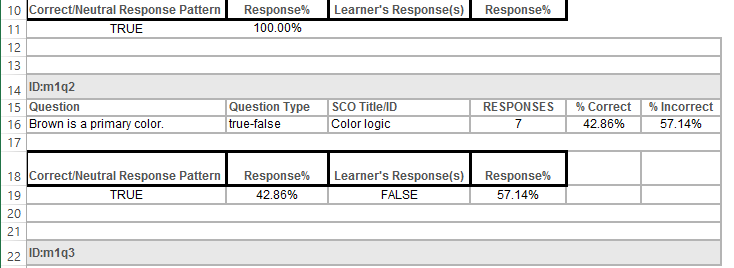
You do get an aggregate of the data for this specific question, but row 17 in the image shows that the first 6 cells of this row have been merged together and then the rest of the data is placed in the next two rows. You’ll be unable to do very much with the data without doing some serious manipulation of the spreadsheet. The image below is how I really want the data.

Obviously not printable report worthy, but I would prefer to have the data exported this way as it would allow me to filter and sort the data so I can build charts and easily find specific data points. Which leads to the purpose of this post.
You can get usable per-user SCORM 2004 data in a custom report, but you have to ask CSOD to enable it. You’ll need access to CSOD’s training/tech support site as well as the ability to submit cases/tickets. If you don’t have the latter, you’ll need to ask someone in your portal with this type of access to do it. You need to specifically request for SCORM 2004 Quiz Data to be enabled for custom transcript reports. Once that’s been enabled you’ll have a new field group available containing SCORM fields.
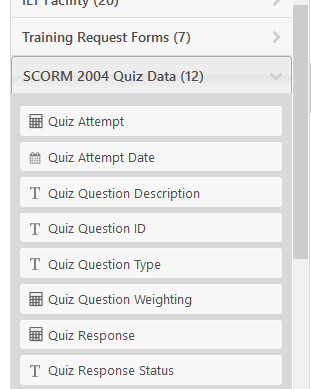
This allows you to create a report that contains the recorded SCORM data from your Captivate file and in a format you can actually do something with.

Something to be aware of is that this isn’t going to get you any data prior to when it’s enabled. Once users take your training from that point forward you’ll get their recorded responses, but anything prior will have empty cells. You can either filter out those empty results from within the custom report interface or remove them after exporting.
With this new SCORM report I’m able to create charts to quickly visualize the data.
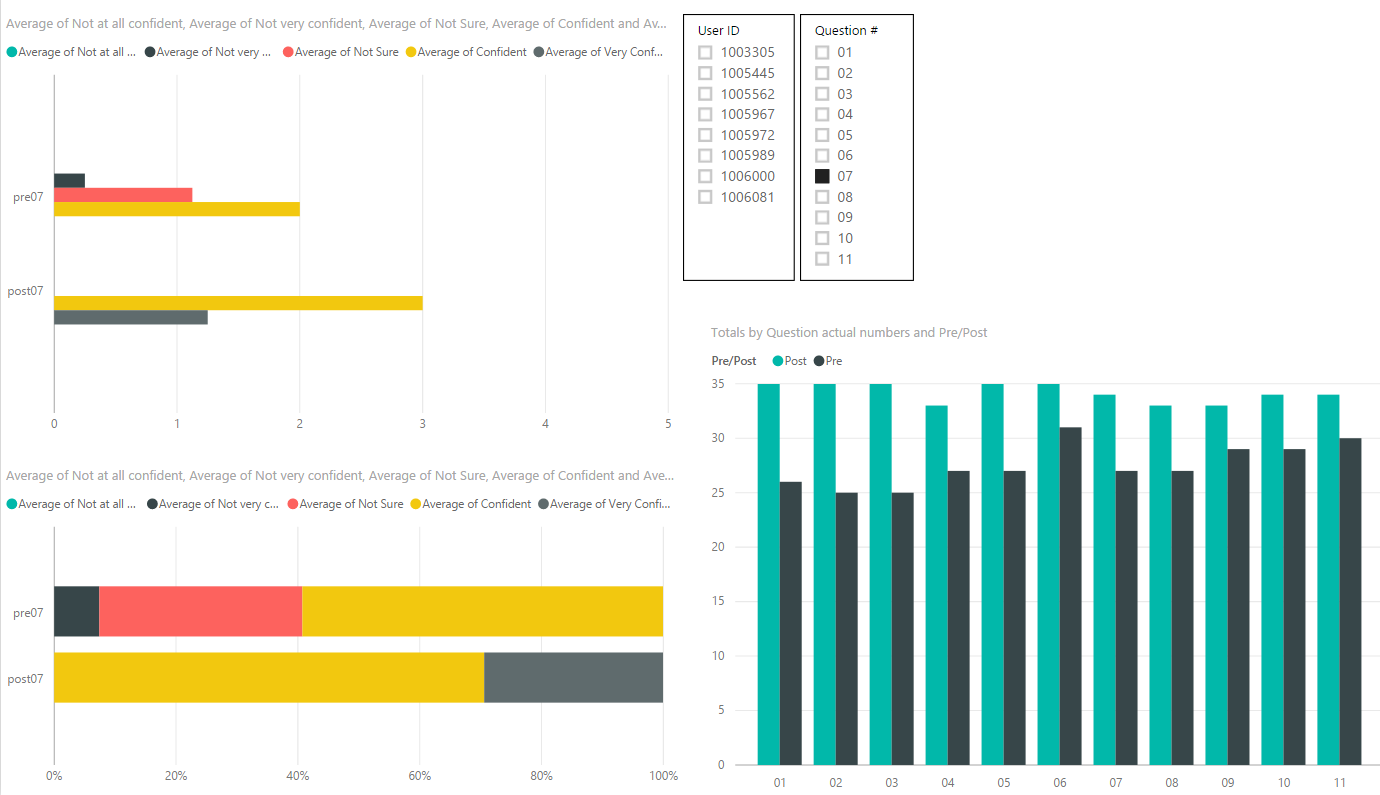
The two charts on the left are showing the difference between the pre and post evaluation data for just question 7 with a clustered bar chart on top and the same data in a stacked bar chart on the bottom. In the upper right I can select specific questions, users, or a combination of both to filter what information is displayed in the two left side charts. The chart on the lower right is a snapshot of the change between the averages of the pre and post data across all 11 questions.
I do need to mention that if you plan on visualizing your data you may need to do some additional grooming after it’s exported. In the image above I did have to add additional columns containing formulas to convert the raw data into specific values in order to get it to a level where I could do more with it.
While I had been fairly successful taking the CAQIA report data and dumping it into a new Excel file so I could at least get an overview of how users were doing, this new level of detail is a massive improvement. I recommend having this additional reporting ability enabled in your CSOD portal if you want or need the additional user information.
When speaking with other Captivate authors who publish their files in Cornerstone OnDemand (CSOD), the most frequent complaint regarding CSOD is the lack of quality, usable reporting of SCORM 2004 data. CSOD has a total of three SCORM 2004 reports and only one of these reports, the ‘Course Assessment Question Item Analysis’ (CAQIA), gives you data showing what users have selected or entered for graded SCORM objects. Unfortunately, all of the data you get is aggregated together so you can’t see how individual users did on specific questions. The structure of the Excel file you get is also poorly constructed as it appears that it’s intended to be printed instead of a dump of the data where you could then filter, sort, and manipulate the information. Fortunately, you can ask CSOD to enable SCORM interaction ID data in custom reports to get per-user data in a typical spreadsheet format.
As I mentioned previously, the CAQIA report does give you some data but the layout of the Excel file is why the report is really bad. The image below shows one of the questions from this type of report. I’ve added the cell borders to help show how the report is structured.
You do get an aggregate of the data for this specific question, but row 17 in the image shows that the first 6 cells of this row have been merged together and then the rest of the data is placed in the next two rows. You’ll be unable to do very much with the data without doing some serious manipulation of the spreadsheet. The image below is how I really want the data.
Obviously not printable report worthy, but I would prefer to have the data exported this way as it would allow me to filter and sort the data so I can build charts and easily find specific data points. Which leads to the purpose of this post.
You can get usable per-user SCORM 2004 data in a custom report, but you have to ask CSOD to enable it. You’ll need access to CSOD’s training/tech support site as well as the ability to submit cases/tickets. If you don’t have the latter, you’ll need to ask someone in your portal with this type of access to do it. You need to specifically request for SCORM 2004 Quiz Data to be enabled for custom transcript reports. Once that’s been enabled you’ll have a new field group available containing SCORM fields.
This allows you to create a report that contains the recorded SCORM data from your Captivate file and in a format you can actually do something with.
Something to be aware of is that this isn’t going to get you any data prior to when it’s enabled. Once users take your training from that point forward you’ll get their recorded responses, but anything prior will have empty cells. You can either filter out those empty results from within the custom report interface or remove them after exporting.
With this new SCORM report I’m able to create charts to quickly visualize the data.
The two charts on the left are showing the difference between the pre and post evaluation data for just question 7 with a clustered bar chart on top and the same data in a stacked bar chart on the bottom. In the upper right I can select specific questions, users, or a combination of both to filter what information is displayed in the two left side charts. The chart on the lower right is a snapshot of the change between the averages of the pre and post data across all 11 questions.
I do need to mention that if you plan on visualizing your data you may need to do some additional grooming after it’s exported. In the image above I did have to add additional columns containing formulas to convert the raw data into specific values in order to get it to a level where I could do more with it.
While I had been fairly successful taking the CAQIA report data and dumping it into a new Excel file so I could at least get an overview of how users were doing, this new level of detail is a massive improvement. I recommend having this additional reporting ability enabled in your CSOD portal if you want or need the additional user information.


You must be logged in to post a comment.
- Most Recent
- Most Relevant
I’m playing with SCORM 2004 in Reporting 2.0 in Cornerstone and am not having success getting SCORM 2004 data out. I can get the data via the legacy reports so I know there’s data there. The test course was updated after we had Reporting 2.0 activated. I’m guessing this is something to do with how I’m setting up filtering (I’m a newbie to reporting).
Can anyone recommend how I might set up my filters to get a question response for a specific question on a user-by-user basis?
Hi Michael,
In the October 2016 CSOD Release, 12 new SCORM 2004 fields were added to custom reporting. I’m still figuring them out myself, but maybe this is something you might be interested to know.
Please disregard this reply, I see you mentioned the new fields in your article. My mistake!
