 Staff
Staff
Are you achieving your course objectives? Do you know if the course is being well received? Do you know how your learners are progressing? Do you know if your learners are learning from the course?
Now Course Companion for Adobe® Captivate® will easily provide you with answers to these questions and many more. Adobe Captivate team launches a preview of this new solution on Adobe Labs.
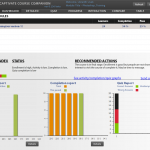
Course Companion for Adobe® Captivate® (A3C) provides content creators with insights that help understand the learner’s response to course content. A3C allows content creators to instantly measure and visualize learner engagement with the learning content.
You will be able to –
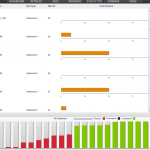
- Track usage of content
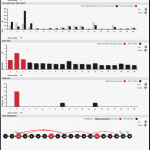
- Track learner behavior
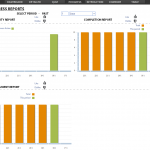
- Get feedback on the course by tracking the learner metrics
- Track progress of the course as you roll it out
- Track effectiveness of the content
It is very simple to enable the courses for tracking through A3C for the content authored through Adobe Captivate 5.5.
- Insert the tracking widget into the slide 1 of the course. Supply just couple of information points for the course.
- Publish the course.
You are ready! You don’t have to change the way you are deploying the course. A3C works if the course is deployed on LMS or on a website or on a CD.
And you do not have to be worried, the learners do not see any change, performance impact due to the course enabled for A3C. A3C silently monitors the data for you without interrupting the learning process.
Come – try out for yourself. Visit http://labs.adobe.com/technologies/captivate_course/ to get started.
Are you achieving your course objectives? Do you know if the course is being well received? Do you know how your learners are progressing? Do you know if your learners are learning from the course?
Now Course Companion for Adobe® Captivate® will easily provide you with answers to these questions and many more. Adobe Captivate team launches a preview of this new solution on Adobe Labs.
Course Companion for Adobe® Captivate® (A3C) provides content creators with insights that help understand the learner’s response to course content. A3C allows content creators to instantly measure and visualize learner engagement with the learning content.
You will be able to –
- Track usage of content
- Track learner behavior
- Get feedback on the course by tracking the learner metrics
- Track progress of the course as you roll it out
- Track effectiveness of the content
It is very simple to enable the courses for tracking through A3C for the content authored through Adobe Captivate 5.5.
- Insert the tracking widget into the slide 1 of the course. Supply just couple of information points for the course.
- Publish the course.
You are ready! You don’t have to change the way you are deploying the course. A3C works if the course is deployed on LMS or on a website or on a CD.
And you do not have to be worried, the learners do not see any change, performance impact due to the course enabled for A3C. A3C silently monitors the data for you without interrupting the learning process.
Come – try out for yourself. Visit http://labs.adobe.com/technologies/captivate_course/ to get started.


You must be logged in to post a comment.
- Most Recent
- Most Relevant
Sounds interesting. But these functions are included in an LMS.
Is there an Adobe Captivate Course Companion for Captivate 7??? That would be great!
Thank’s
Matthias
After some digging i found the widget in Captivate 7. Go to Insert>Widget and you should see the A3C widget listed. However, the course I made is not showing up with I sign in to the dashboard.
“Supply just couple of information points for the course.”
Ok what do we put in here? Mine doesn’t work… Please be very specific.. thanks!
Are there any specific settings in the Quiz preferences that need to be set? We don’t have an LMS, and I have tried different settings as well as non, and though the submission does post, there is not any data to go with it.
Hi Ashish, Thanks for the information and for your efforts.
After publishing and upon attempting to open the .html for the published course, I get a “There was a problem sending the command to the program” error.
I’m on Captivate 6, 64 bit, did an Insert>Widget on the first slide in the bounds of that slide and published as swf. Any ideas what I need to do to get this working? Any advice is appreciated…
[…] Companion for Adobe Captivate (A3C) has been on adobe labs for while. With the release of Adobe Captivate 6, this has also evolved quite a bit and you can use it with […]
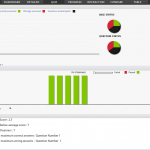
I can publish a Captivate project containing a quiz that reports to https://als.adobe.com, and I can see the overall quiz results. However, I can’t see the results question-by-question, apparently because ‘Question Number Undefined’. This may be because the questions are being drawn from 10 different question pools. Is there a way to see performance organized by question pools (or as a percent by question, accepting that some questions happen to get drawn more than others)?
Hi,
Unfortunately, current version of course companion doesnt support the Random question pools. So the quetsion details for questions picked form Random question pool would not be accurate. We do have it in our list of things to do.
Any suggestions on how you would want to see the analysis for questions drawn from question pool would be most welcome.
Regards
Subra
Developer
Adobe Captivate Team
[…] Companion for Adobe Captivate – The Progress Index I hope you would have started using the Course Companion for Adobe Captivate by now. We had many queries regarding the new concept of Progress Index. In this blog, I will try […]
thanks for share..
I’m happy to see how far this has come since I first saw it! Good job!
Joe Ganci
…and where are the results posted??? what do i need for this?
The results are posted back to an Adobe server (als.adobe.com). You just need an Adobe Id for this. Please note that learners do not need anything. Only the person who is enabling the course for analytics require it. If you have an Adobe Id, you can use that OR you can create one right from the tracking widget. After that you can log back in to the dashboard using the same Adobe Id and see the reports for your course.
I’m sorry, but I didn’t get it…
is this widget sending the data automatically to the server? or how is it working?
Yes, this Widget is sending the data to server automatically. This widget listens to many events in the contents like button click, slide enter etc. and send that data to server.
and how does the widget know which is my project?
When you insert the Widget in a course, you specify the course name and version. Thats how Widget knows your project and thats how you can see the data about this project when you go to the dashboard.
I tried this now…it’s not working. I published a course on our LMS, set the widget on first page, and specified course name and version…but nothing happend.
Lets resolve it over the email and post the learnings here. If you can send an email to me at asgarg@adobe.com, I will have someone work with you.
Thanks.
Matt, thanks for taking out time and working with us to resolve this. For other, resolution is – The Widget must be put inside using ‘Insert -> Widget’ from the menu OR from the Widget panel. Drag-dropping it on to the project will not work as it will be inserted as Animation. We will update the documentation as well.
I didn’t get what this application do.
This solution essentially gives you certain analytics on the course. These analytics are taken as the learners take the course. These analytics will help you in understanding how learners are going through the course. You can use these analytics to tweak your course in case you feel that learners are not progressing through the course as you intended. The reports are presented as graphs and they are very intuitive to understand. I suggest you sign up and there is a sample course with the data. Go through the reports and it will help you in understanding the system better.
[…] jQuery("#errors*").hide(); window.location= data.themeInternalUrl; } }); } blogs.adobe.com – Today, 2:10 […]
Thank you for this very good course.
